

Service Visualization
Visualize the health of your critical services from multiple perspectives, reduce blind spots and deliver actionable insights to ITOps, service owners, SREs and beyond.


Transform your IT monitoring landscape
Move away from reactive, technical/component centered IT monitoring to a service based, proactive and predictive position. Deliver an accurate, holistic representation of service health - connecting technology state information to its relative impact on the business bottom line. Protect service availability, from the data centre to the cloud, in shared, virtualized environments;
even at the speed of Agile/DevOps.
even at the speed of Agile/DevOps.
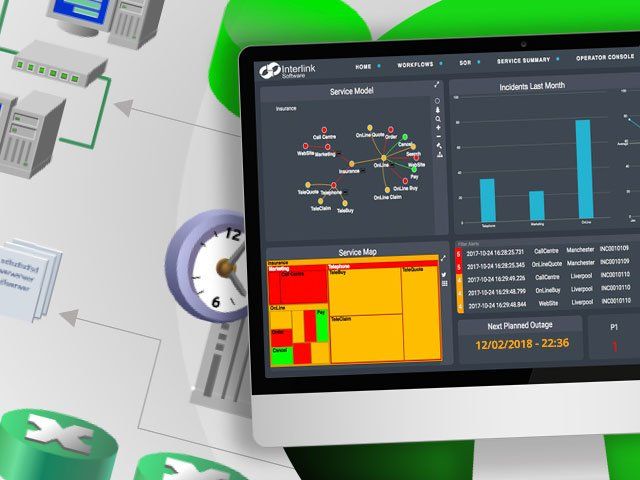
Single-pane-of-glass, real-time service availability views. Identify key business services at risk of failure at a glance
A dynamic, data driven approach, seamlessly integrated with your existing IT management tools
Automated Service Modelling - top-down service topology and dependency mapping approach
Drill down into underlying technical events – for rapid triage - reducing incident response times
Reduce the duration, frequency and impact of major incidents. Proactively remediate issues in advance of business impact
Easy to customize, web-based dashboards to support unique business and IT requirements
Service Visualization
View service health, your way - on any device

Automated Service Reporting
Service Visualization brings with it the ability to implement automated real-time and historical service and availability reporting.
Organizations often have limited in-house developed solutions for reporting. These solutions tend to leverage data drawn after-the-fact from their ITSM tools, using spreadsheet-based outputs.
It can take around five working days to produce monthly service availability reports. This usually involves significant manual effort and a time-lag.

Sample Service Report Dashboard
Automated Service Reporting Capabilities
Automatically track downtime, outages and percentage availability in both real-time and historically for any service modelled customer, business or IT service - down to technology configuration item (CI) level.
Associate service hours, holidays, planned outages, and SLA tracking criteria with service models at any level in the hierarchy are provided.
Early warning before operational targets or SLAs are breached is supported. True train of thought ‘What level of service did we provide for customers of Service ABC last month?’ reporting is supported.
The following service facts are automatically calculated and stored for each service and sub-service, based on the service model’s resident on the Interlink Software Service Visualization tool:
- Mean Time to Repair - MTTR
- Mean Time Between Service Incidents - MTBSI
- Mean Time Before Failure - MTBF
- Percentage Availability
- Time Unavailable
- Incident Period Length
- Number of Incidents
- Longest Outage
- SLA Status (Pass, Fail)
The ability to define customer specific tracking criteria and logic to be inserted into service reports and calculations is also supported.
More on Service Visualization from the Interlink Team

Delivering a Global Manager of Managers Solution
For distributed IT teams within global organizations, that need to maintain full visibility of service health.

Service Visualization in a
Multisourced IT Environment
Grant Glading, Head of Sales and Marketing at Interlink Software illustrates how service visualization can help achieve supplier performance transparency and drive a successful multisourcing strategy.
Back to the Future with Single-Pane-of-Glass
Grant Glading, Head of Sales and Marketing at Interlink Software talks about lessons to be taken from IT monitoring history and Single-Pane-of-Glass views.
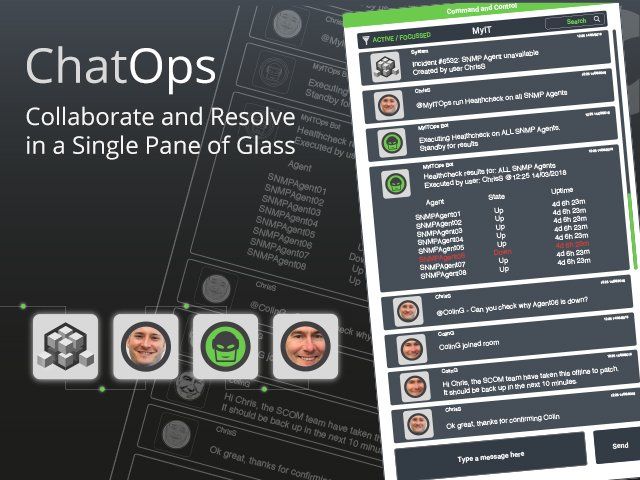
ChatOps - Collaborate and Resolve -
in a Single-Pane-of-Glass
Chris Sunter, Senior Technical Consultant at Interlink Software on the benefits of a collaboration platform that brings together people, tools and workflows – to help resolve outages in a transparent and standardized manner.


